Expert Insights
Blogs
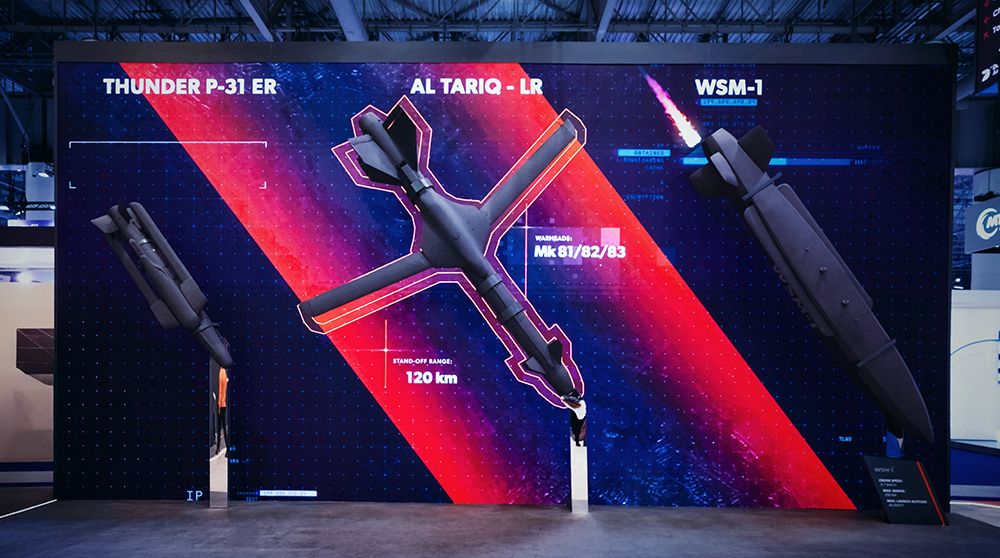
Engineering Authority: How We Designed the Evaluation Environment at Dubai Airshow 2025
At the Dubai Airshow 2025, the mission was to move beyond traditional marketing displays and instead engineer a high-credibility evaluation environment. In a sector populated by technical experts and strategic decision-makers, every digital and spatial choice was a creative solution designed to establish immediate authority and trust.